4. Data Presentation Guide
4.1. General Information on Data Presentation
4.1.1. The "Present" Menu
After choosing the option "Data Presentation" from the "Main" menu (compare figure 3.1-1), the "Present" menu will be displayed as shown in figure 4.1-1:
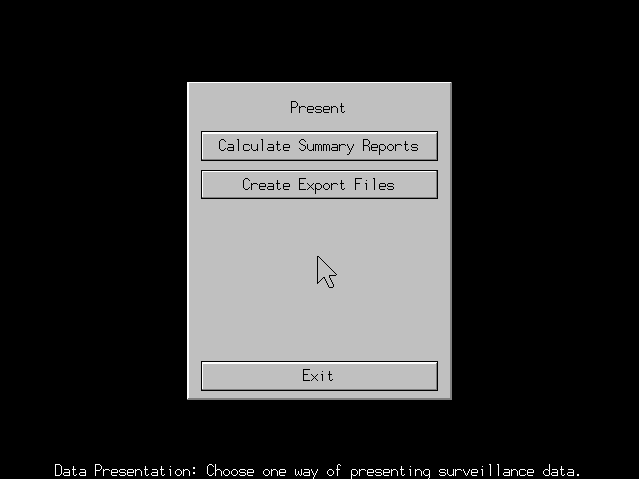
Fig. 4.1-1: The "Present" menu gives a choice of data presentation methods.
From the "Present" menu you can choose which method of data presentation you want to do. The
"Present" menu consists of a big box in the center of the screen, the message line at the bottom of the
screen and a little arrow, the pointer. When you position the pointer above one option, the message line will contain a short help on that option. You can choose from three options:
4.1.2. Settings for Calculating a Summary Report
After the option "Calculate Summary Reports" was chosen in the "Present" menu (compare figure 4.1-1),
the screen "Settings for Calculating a Summary Report" (compare figure 4.1-2) will be displayed:
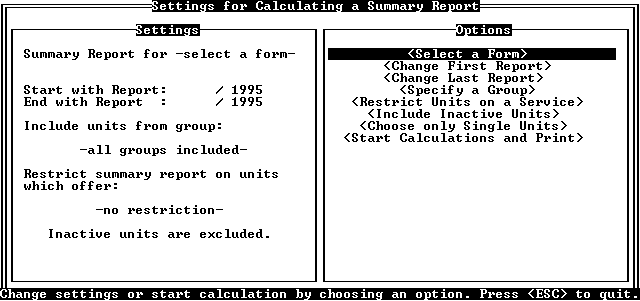
Fig. 4.1-2: The screen layout "Settings for Calculating a Summary Report".
In this screen you can define the settings for calculating a summary report: you can select the form for
which you want to calculate a summary report, you can specify the first and the last report to be included and you can restrict the selection of health units for which you want to calculate a summary report. The
screen is contains two boxes. On the right hand side you find the "Settings" box with the settings that were
already defined. On the left hand side you find the "Options" box with a list of options for modifying the settings.
One of the options is highlighted. In figure 4.1-2 the option "Select a Form" is highlighted. The highlighted
option is the one to take place when you press the <Enter> key. E.g. if you press the <Enter> key while
the option "Select a Form" is highlighted, you will be able to select a report form for the summary report. You can highlight other options by pressing the up / down arrow keys on the keyboard.
You can choose from the following options:
- Select a Form: When this option is highlighted, pressing <Enter> gives you a list of report forms (compare figure 3.1-2). These are the same forms, which were used for data entry. From this list
you can choose the report form, for which you want to calculate a summary report. The list might differ depending on the installation of the staff member who is responsible for organizing the statistics
office. One of the report forms is highlighted. In figure 3.1-2 this is "MF77ANC", which is used for ante-natal care services. It will be chosen when you press the <Enter> key. You can highlight
another report form by pressing the up / down arrow keys. Your choice will be displayed in the
"Settings" box as shown in figure 4.1-3. In the "Options" box, the option "Change First Report" is highlighted now.
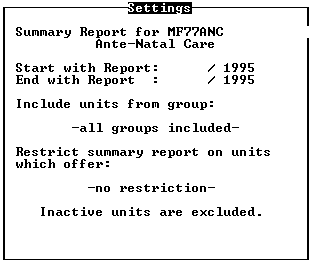
Fig. 4.1-3: The "Settings" box for calculating a summary report after selection of the report form "MF77ANC".
- Change First Report: Select this option to specify the first reporting period which will be included in the summary report. You have to enter a report number and the according year. After selecting
this option the cursor moves to the entry field for the report number. When entering the report number, you have to know the reporting frequency of the form. If you have a monthly report, you
can take the number of the month as number of the report. E.g. the report for May would be report number five and the report for August would be report number eight. After you have entered the
report number, the cursor moves to the entry field for the reporting year. The current year has been entered as a default value already. If the current year is correct, simply press <Enter> to continue. If
the current year is not correct, enter the correct year manually on the keyboard. Always enter four
digits for the year. E.g. for the year "1994" it is not sufficient to enter "94". You have to enter "1994"
completely. After entering the year, the option "Change Last Report" will be highlighted.
- Change Last Report: Selecting this option lets you specify the last reporting period which will be included in the summary report. Specifying the last report works in the same way as specifying the
first report. You have to make sure that you do not enter a reporting number and year which is prior
to the first report. In that case "Kabarole!" will adapt the entries of the first report to those of the last
report. E.g. 9/1994 was chosen for the first report. Entering 8/1994 for the last report will set the first report to 8/1994 as well. Specifying one report as first and last report at the same time will
generate a summary report for only that month. E.g. entering 8/1994 as first report and as last report will generate the summary report for 8/1994. Figure 4.1-4 depicts the "Settings" box after
8/1994 was entered as first and last report. The option "Specify a Group" is highlighted in the "Options" box.
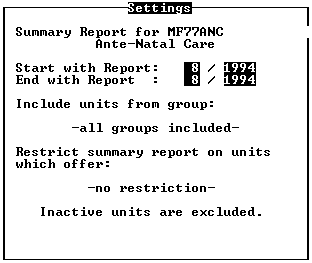
Fig. 4.1-4: The "Settings" box after 8/1994 was entered as the only reporting period to be included into the summary report.
- Specify a Group: With this option you can choose only member units of a defined group to be included into the summary report. For example: you want to calculate a summary report for a
specific county. In that case you choose the county from the available groups. Summary will be done only on health units from that county. However, this will only work, when the staff member
who is responsible for organizing the statistics office has defined these groups in the system setup. Chapter 5.3. "Defining Groups" explains, how to define groups.
Pressing the <Enter> key when this option is highlighted, gives you two boxes on the screen (compare
figure 3.1-5): one box is named "Categories", the other is named "Groups". Each group belongs to a
category. When a category is highlighted in the "Categories" box, you can see the groups that belong to
that category listed in the "Groups" box. In the example used in figure 3.1-5 you will find the groups
"Bunyangabo", "Burahya", "Kibale", "Kitagwenda", "Kyaka" and "Mwenge" in the "Groups" box. All these
belong to the category "Counties" which is highlighted in the "Categories" box. Note that on your computer
you might find different categories and groups. This depends on the installation of the staff member who is responsible for organizing the statistics office.
As you press the up / down arrow keys, you will highlight another category. At the same time, the
"Groups" box will be updated. If, in the above example, you press the down arrow key, the category
"Malaria - Endemic Areas" will be highlighted, and the "Groups" box would contain the groups
"Hyperendemic Malaria Area", "Hypoendemic Malaria Area" and "Mesoendemic Malaria Area". As you
press the <Enter> or the right arrow key, the highlighted bar moves to the first group in the "Groups" box.
In the "Groups" box, you can also highlight another group by pressing the up / down arrow keys. Pressing
the <Esc> key or the left arrow key returns the highlighted bar back to the "Categories" box without
selecting a group. Pressing the <Enter> key selects the highlighted group for data entry. After this,
"Kabarole!" returns to the screen "Settings for Calculating a Summary Report" (compare figure 4.1-2)
where the selected group is entered in the "Settings" box as shown in figure 4.1-5 and where the option "Restrict Units on a Service" is highlighted now.
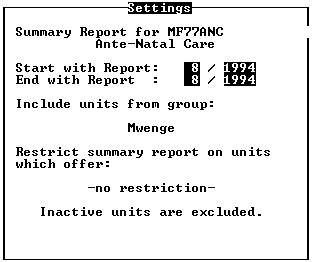
Fig. 4.1-5: The "Settings" box after the county "Mwenge" has been chosen as group of health units, for which a summary report shall be calculated.
- Restrict Units on a Service: You can use this option to include only specific health units to the summary report: those which provide a specific service. This is essential, when you want to
summarize reports which are only returned from health units that offer a specific service. "Kabarole!" informs you on how many reports were included into the summary report and how
many are missing. If you calculate a summary report for the report form of ante natal care services, you must restrict the included health units to those which offer this service. If you include all health
units, "Kabarole!" will expect one report from each existing health unit. But only those health units,
which provide a service can return a report on that service. Therefore "Kabarole!" will produce a wrong value on the missing reports, unless you specify the service.
After pressing <Enter> when the option "Restrict Units on a Service" is highlighted, you will find a box
with the available services on the screen. Figure 3.1-7 gives an example of available services. This list might differ from the one you find on your computer. Only those services are listed, which have been
defined by the staff member who is responsible for organizing the statistics office. Refer to chapter 5.4. "Defining Services" for further information on how to define services.
In figure 3.1-7 the service "Ante-Natal Care" is highlighted. When pressing the <Enter> key, the summary
report will be restricted to those units, which provide ante-natal care. By pressing the up / down arrow keys another service can be highlighted. Pressing the <Esc> key will leave the list of services without
restricting the summary report on a service. Figure 4.1-5 depicts the "Settings" box, after a service was
selected. In the "Options" box, the option "Include Inactive Units" is highlighted.
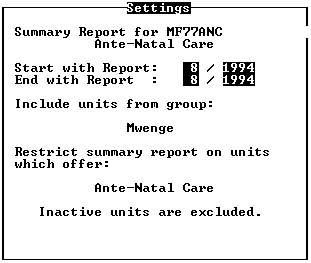
Fig. 4.1-6: The "Settings" box, after the calculations were restricted to "Ante-Natal Care".
- Include Inactive Units: Sometimes you want a summary report from a period, when some health units were active, which are not performing any more. You can include these health units into the
summary report by pressing <Enter>, when this option is highlighted. The setting "Only active units
are included." is toggled to "Inactive units are included.". The option "Include Inactive Units" is
replaced by the option "Exclude Inactive Units" in the "Options" box. The option "Choose only Single Units" is highlighted.
- Choose only Single Units: If you want to summarize reports of one specific health unit, you can select that unit from the district map. When you choose this option, the settings for the group and the
service will not have an effect. Pressing <Enter> when this option is highlighted brings you to the district map (compare section 4.1.3. "The District Map for Selecting Single Health Units for Summary Reports").
- Start Calculations and Print: Pressing <Enter> when this option is highlighted will start the process of summarizing reports. However, you can only start summary after you have specified a
data entry form and a valid reporting period. "Kabarole!" will continue with summarizing as described in section 4.1.4. "The Calculated Summary Report".
4.1.3. The District Map for Selecting Single Health Units for Summary Reports
After you have chosen the option "Choose only Single Units" from the screen "Settings for Calculating a
Summary Report" (compare figure 4.1-2), the district map appears on the screen (compare figure 4.1-7). From this map you can select the health unit, for which you want to summarize reports. Of course this map
looks different in other districts. Also there might be variations within one district, depending on how the system setup was done.
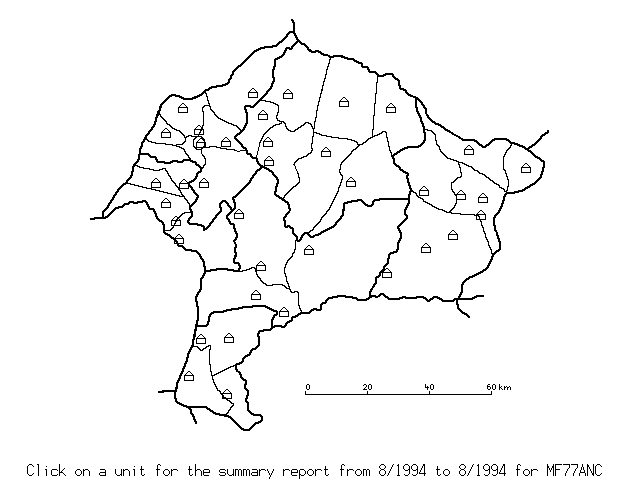
Fig. 4.1-7: The district map for selecting a single health unit for summary reports.
Each health unit appears as a little house. When the pointer points at a health unit, the name of the health
unit appears in the message line at the bottom of the screen. Clicking the mouse button starts the process
of summarizing the reports of that health unit. The pointer has to be positioned correctly with the tip inside the little house, though, as shown in figure 4.1-8:

Fig. 4.1-8: The pointer points at the health unit Kyarusozi.
You can leave the screen with the district map by pressing the <Esc> key. This returns you to the screen "Settings for Calculating a Summary Report" (compare figure 4.1-2).
4.1.4. The Calculated Summary Report
After you have either selected a health unit from the district map (compare figure 4.1-7) or chosen the
option "Start Calculations and Print" in the screen "Settings for Calculating a Summary Report" (compare
figure 4.1-2), the report form is loaded by "Kabarole!". The screen will look similar to the one displayed in figure 4.1-9:
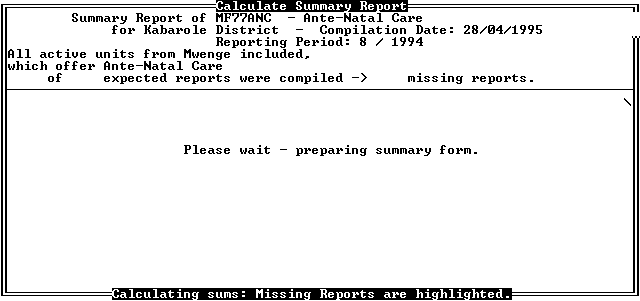
Fig. 4.1-9: The screen "Calculate Summary Report" while "Kabarole!" is loading the report form "MF77ANC - Ante-Natal Care".
The screen is contains two boxes: The status box at the top of the screen displays general information on
the current summary session. You can see that all active units from Mwenge county are included which offer ante-natal care. Also you can see the name of the report form which is being loaded, "MF77ANC -
Ante-Natal Care", and the reporting period, for which the summary report will be calculated. The progress
box in the center of the screen displays the progress of the summary session. In figure 4.1-9 it contains the
message "Please wait - preparing summary form.". The little spinning bar in the top right corner indicates, that "Kabarole!" is still busy loading.
If the data file which is needed for summarizing is not available on the harddisk, you will find the message from figure 4.1-10 on the screen:

Fig. 4.1-10: This message will appear on the screen, when "Kabarole!" cannot find the data file for the demanded period, although it should exist already.
This message is most likely to appear, when you summarize data of a period, which has been archivated already. More detailed information on archivated data is given in chapter 6.2.2. "Archivating Old Data Files". Ask the staff member, who is responsible for organizing the statistics office, where you can find the
disk with the archivated data file for this period. If the disk is lost, choose the option "Cancel" by pressing
the left / right arrow keys. Press <Enter> when the option is highlighted. If the floppy disk is still available,
you can choose the option "Work with Floppy". You will receive a message similar to the one in figure
3.1-10. Now insert the floppy disk into the disk drive and specify the letter of that drive. You can highlight
either "Drive A:" or "Drive B:" by pressing the right / left arrow keys. Press <Enter> when the required
drive is selected. "Kabarole!" will now use the data from floppy disk. Be aware, that working with the floppy disk is slower than the normal way.
If the required data file is available, "Kabarole!" will start with the calculations. The progress of the
calculations is shown in the progress box. The progress box will look similar to the one depicted in figure 4.1-11:
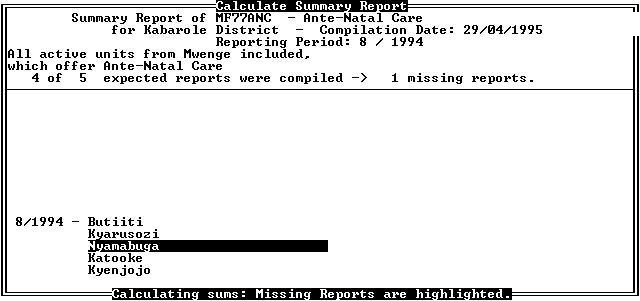
Fig. 4.1-11: The screen "Calculate Summary Report" while "Kabarole!" is calculating the summary report.
For each reporting period there is a list of health units which were included in the calculations already.
Health units, for which no report has been entered, yet, are highlighted. E.g. in figure 4.1-11 you can see
that "Kabarole!" found the reports of Butiiti, Kyarusozi, Katooke and Kyenjojo. The report 8/1994 of
Nyamabuga has not been entered, yet. After the calculations are complete, "Kabarole!" presents a preview of the summary report (compare figure 4.1-12).
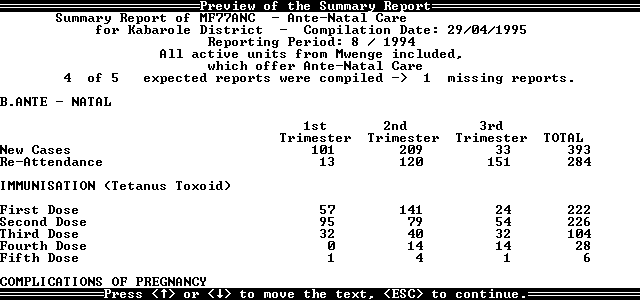
Fig. 4.1-12: After the calculations are complete, a preview of the summary report is presented.
The area between the top and the bottom lines of the screen displays, what the summary report will look
like in the print out. If the summary report exceeds the length of the screen, the up / down arrow keys can
be used to show the hidden parts. After pressing the <Esc> key, you get the choice to either print the
report right away or to create a text file. You can modify the text file with an external text editor. Figure 4.1-13 shows the according message:

Fig. 4.1-13: The summary report can be stored in a text file, or sent to a printer.
You can choose one of the options by moving the highlighted bar with the left / right arrow keys and
pressing <Enter> on the wanted option. If you choose the option "Print", make sure that the printer is
connected properly to the computer. Otherwise the system error message from figure 4.1-14 will be generated. In this case you can check the printer and choose the option "Retry" after the printer is
functional. Be aware that the option "Quit" terminates "Kabarole!" completely. After "Kabarole!" has
completed the print out it returns to the screen "Settings for Calculating a Summary Report" (compare figure 4.1-2).

Fig. 4.1-14: If "Kabarole!" cannot access the printer, a system error message is generated.
If you choose the option "Create Text-File" from the message in figure 4.1-13, "Kabarole!" needs to know
a name for the text file. You can enter the name in the highlighted entry field in the message box depicted in figure 4.1-15:
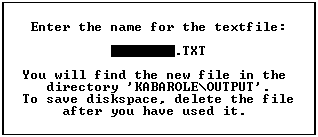
Fig. 4.1-15: "Kabarole!" needs to know a name for the text file, as which the summary report has to be saved.
The name has to be a valid MS-DOS file name. The extension "TXT" is given automatically. Press
<Enter> to accept the filename. After this "Kabarole!" creates the text file in the directory "OUTPUT". If
you have chosen a single health unit, "Kabarole!" returns to the district map (compare figure 4.1-7),
otherwise it returns to the screen "Settings for Calculating a Summary Report" (compare figure 4.1-2).
4.1.5. Settings for Creating a "DBase III" Compatible Export File
After the option "Create Export Files" was chosen in the "Present" menu (compare figure 4.1-1), the
screen "Settings for Creating a DBaseIII Compatible Export File" (compare figure 4.1-16) is displayed:
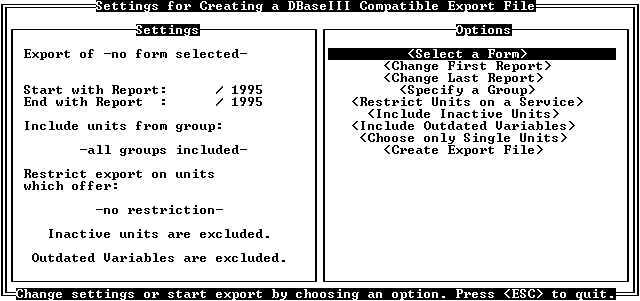
Fig. 4.1-16: The screen layout "Settings for Creating a DBaseIII Compatible Export File".
In this screen you can define the settings for creating an export file: you can select the form for which you
want to create an export file, you can specify the first and the last report to be included and you can restrict the selection of health units for which you want to create an export file. The screen contains two
boxes. On the right hand side you find the "Settings" box with the settings which were already defined. On
the left hand side you find the "Options" box with a list of options for modifying the settings.
One of the options is highlighted. In figure 4.1-16 the option "Select a Form" is highlighted. The highlighted
option is the one to take place when you press the <Enter> key. E.g. if you press the <Enter> key while
the option "Select a Form" is highlighted, you will be able to select a form for data export. You can highlight other options by pressing the up / down arrow keys on the keyboard.
You can choose from the following options:
- Select a Form: When this option is highlighted, pressing <Enter> gives you a list of forms (compare figure 3.1-2). From this list you can choose the form, for which you want to export data.
However, this list only displays the forms which have been installed. One of the forms is highlighted. In figure 3.1-2, this is "MF77ANC", which is used for ante-natal care services. This form will be
chosen when you press the <Enter> key. You can highlight another form by pressing the up / down arrow keys. Your choice will be displayed in the "Settings" box as shown in figure 4.1-17. In the
"Options" box, the option "Change First Report" is highlighted now.
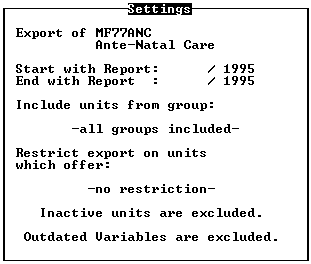
Fig. 4.1-17: The "Settings" box for creating an export file after selection of the form "MF77ANC".
- Change First Report: Select this option to specify the first reporting period which will be included in the export file. You have to enter a report number and the according year. After selecting this
option, the cursor moves to the entry field for the report number. When entering the report number, you have to know the reporting frequency of the report. If you have a monthly report, you can take
the number of the month as number of the report. E.g. the report for May would be report number five and the report for August would be report number eight. After you have entered the report
number, the cursor moves to the entry field for the reporting year. The current year has been entered as a default value already. If you want to export data from that year, simply press <Enter>
to continue. If you want to export data from another year, enter the year manually on the keyboard.
Always enter four digits for the year. E.g. for the year "1994" it is not sufficient to enter "94". You
have to enter "1994" completely. After entering the year, the option "Change Last Report" will be highlighted.
- Change Last Report: Selecting this option lets you specify the last reporting period which will be included in the export file. Specifying the last report works in the same way as specifying the first
report. You have to make sure that you do not enter a reporting number and year which is prior to
the first report. In that case "Kabarole!" will adapt the entries of the first report to those of the last
report. E.g. 9/1994 was chosen for the first report. Entering 8/1994 for the last report will set the first report to 8/1994 as well. Specifying one report as first and last report at the same time will
generate an export file for only that month. E.g. entering 8/1994 as first report and as last report will generate an export file for 8/1994. Figure 4.1-18 depicts the "Settings" box after 8/1994 was
entered as first and last report. The option "Specify a Group" will be highlighted in the "Options" box.
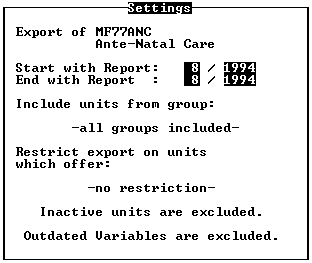
Fig. 4.1-18: The "Settings" box after 8/1994 was entered as the only reporting period to be included into the export file.
- Specify a Group: With this option you can choose only member units of a defined group to be included into the export file. For example: you only want to export data of a specific county. In that
case you choose the county from the available groups. The export will be done only for health units from that county. However, this will only work when the staff member who is responsible for
organizing the statistics office has defined these groups in the system setup. Chapter 5.3. "Defining Groups" explains, how to define groups.
Pressing the <Enter> key when this option is highlighted, gives you two boxes on the screen (compare
figure 3.1-5): one box is named "Categories", the other is named "Groups". Each group belongs to a
category. When a category is highlighted in the "Categories" box, you can see the groups that belong to
that category listed in the "Groups" box. In the example used in figure 3.1-5 you will find the groups
"Bunyangabo", "Burahya", "Kibale", "Kitagwenda", "Kyaka" and "Mwenge" in the "Groups" box. All these
belong to the category "Counties" which is highlighted in the "Categories" box. Note that on your computer
you might find different categories and groups. This depends on the installation of the staff member who is responsible for organizing the statistics office.
As you press the up / down arrow keys, you will highlight another category. At the same time, the
"Groups" box will be updated. If, in the above example, you press the down arrow key, the category
"Malaria - Endemic Areas" will be highlighted, and the "Groups" box would contain the groups
"Hyperendemic Malaria Area", "Hypoendemic Malaria Area" and "Mesoendemic Malaria Area". As you
press the <Enter> or the right arrow key, the highlighted bar moves to the first group in the "Groups" box.
In the "Groups" box, you can also highlight another group by pressing the up / down arrow keys. Pressing
the <Esc> key or the left arrow key returns the highlighted bar back to the "Categories" box without
selecting a group. Pressing the <Enter> key selects the highlighted group for exporting data. After this,
"Kabarole!" returns to the screen "Settings for Creating a DBaseIII Compatible Export File" (compare
figure 4.1-16) where the selected group is entered into the "Settings" box as shown in figure 4.1-19 and where the option "Restrict Units on a Service" is highlighted now.
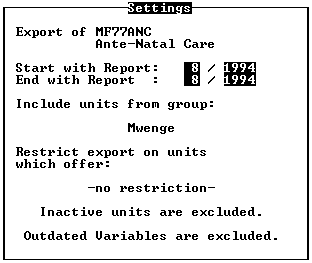
Fig. 4.1-19: The "Settings" box after the county "Mwenge" was chosen as group of health units, from which data shall be exported.
- Restrict Units on a Service: You can use this option to include data from only specific health units into the export file: those which provide a specific service. After pressing <Enter> when this
option is highlighted, you will find a box with the available services on the screen. Figure 3.1-7 gives an example of available services. This list might differ from the one you find on your computer. Only
those services are listed, which have been defined by the staff member who is responsible for organizing the statistics office. Refer to chapter 5.4. "Defining Services" for further information on
how to define services.
In figure 3.1-7 the service "Ante-Natal Care" is highlighted. When pressing the <Enter> key, data export
will be restricted to the units which provide ante-natal care. By pressing the up / down arrow keys another
service can be highlighted. Pressing the <Esc> key will leave the list of services without restricting data
export to a service. Figure 4.1-20 depicts the "Settings" box, after a service was selected. In the "Options" box, the option "Include Inactive Units" is highlighted.
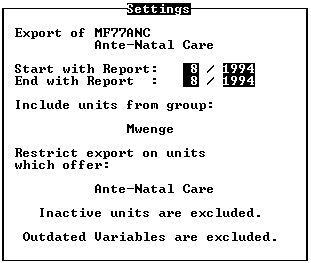
Fig. 4.1-20: The "Settings" box, after data export was restricted to "Ante-Natal Care".
- Include Inactive Units: Sometimes you want to export data from a period, when some health units were active, which are not performing any more. You can include these health units by pressing
<Enter>, when this option is highlighted. The setting "Only active units are included." is toggled to
"Inactive units are included.". The option "Include Inactive Units" is replaced by the option "Exclude Inactive Units". The option "Include Outdated Variables" highlighted.
- Include Outdated Variables: This option specifies whether outdated variables are exported. Outdated variables are generated, when an old data entry form is being updated. Outdated
variables used to be part of the old form, but are not included into the new form. Sometimes you want to export data from a period, when the old form was still in use. Normally "Kabarole!" exports
only those variables, which are also part of the current version of the form. You can include outdated variables by pressing <Enter>, when the option "Include Outdated Variables" is
highlighted. The setting "Outdated variables are excluded." is toggled to "Outdated Variables are
included.". The option "Include Outdated Variables" is replaced by the option "Exclude Outdated Variables". The option "Choose only Single Units" is highlighted.
- Choose only Single Units: If you want to export data of only one specific health unit, you can select that unit from the map. When you choose this option, the settings for the group and the
service will not have an effect. Pressing <Enter> when this option is highlighted brings you to the district map (compare section 4.1.6. "The District Map for Selecting Single Health Units for an Export File").
- Create Export File: Pressing <Enter> when this option is highlighted will start the export. However, you can only start the export after you have specified a report form and a valid reporting
period. "Kabarole!" starts the export as described in section 4.1.7. "The Export File".
4.1.6. The District Map for Selecting Single Health Units for an Export File
After you have chosen the option "Choose only Single Units" from the screen "Settings for Creating a
DBase III Compatible Export File" (compare figure 4.1-16), the district map for selecting single health
units for an export file appears on the screen. It looks like the district map for selecting single health units for calculating a summary report (compare figure 4.1-7). From this map you can select the health unit,
from which you want to export data. Of course this map looks different in other districts. Also there might be variations within one district, depending on how the system setup was done.
Each health unit appears as a little house. When the pointer points at a health unit, the name of the health
unit appears in the message line at the bottom of the screen. Clicking the mouse button starts the export. The pointer has to be positioned correctly with the tip inside the little house, though, as shown in figure
4.1-8. You can leave the screen with the district map by pressing the <Esc> key. This brings back the screen "Settings for Creating a DBaseIII Compatible Export File" (compare figure 4.1-16).
4.1.7. The Export File
After you have either selected a health unit from the district map, or chosen the option "Create Export File"
from the screen "Settings for Creating a DBaseIII Compatible Export File" (compare figure 4.1-16),
"Kabarole!" asks you to enter a name for the export file. You can enter the name in the entry field of the message depicted in figure 4.1-21. Here, the file name "ANC8MWEN.DBF" was chosen:
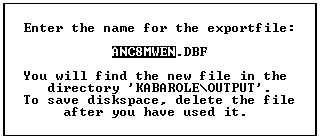
Fig. 4.1-21: The entry field for entering a file name for the export file.
The name has to be a valid MS-DOS file name. The extension "DBF" is given automatically. Press
<Enter> to accept the filename. "Kabarole!" will create the export file in the directory "OUTPUT". After
specifying a name, the export file must be prepared by "Kabarole!". The screen will look similar to the one displayed in figure 4.1-22:
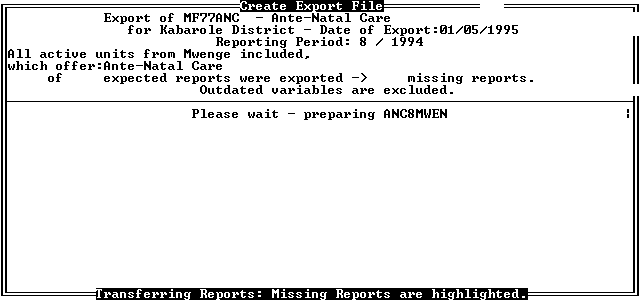
Fig. 4.1-22: The screen "Create Export File" while "Kabarole!" is preparing the export file "ANC8MWEN".
The screen is divided into two boxes: The status box at the top of the screen displays general information
on the current export session. You can see that all active units from Mwenge county are included which offer ante-natal care. Also you can see the name of the form which is being exported, "MF77ANC -
Ante-Natal Care", and the reporting period, for which data are exported. The progress box in the center of the screen displays the progress of the summary session. In figure 4.1-22 it contains the message
"Please wait - preparing ANC8MWEN". The little spinning bar in the top right corner indicates, that "Kabarole!" is still busy with the preparations.
If the data file which is needed for exporting is not available on the harddisk, you will find the message
from figure 4.1-10 on the screen. This message is most likely to appear, when you export data of a period, which has been archivated already. More detailed information on archivated data is given in chapter 6.2.2. "Archivating Old Data Files". Ask the staff member, who is responsible for organizing the statistics office,
where you can find the disk with the archivated data file for this period. If the disk is lost, choose "Cancel"
by pressing the left / right arrow keys. Press <Enter> when the option is highlighted. If the floppy disk is
still available, you can choose the option "Work with Floppy". You will receive a message similar to the
one in figure 3.1-10. Now insert the floppy disk into the disk drive and specify the letter of that drive. You
can highlight either "Drive A:" or "Drive B:" by pressing the right / left arrow keys. Press <Enter> when the
required drive is selected. "Kabarole!" will now use the data from floppy disk. Be aware, that working with the floppy disk is slower than the normal way.
If the required data file is available, "Kabarole!" will start the export. The progress of the export is shown
in the progress box. The progress box will look similar to the one depicted in figure 4.1-23:
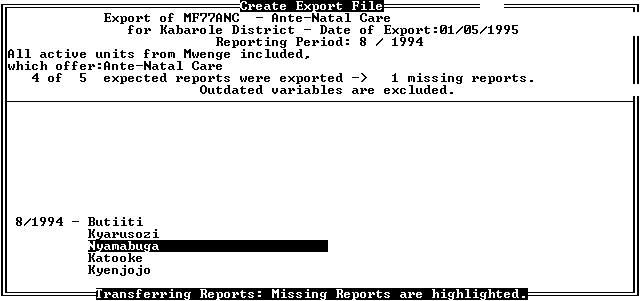
Fig. 4.1-23: The screen "Create Export File" while "Kabarole!" is busy exporting data.
For each reporting period there is a list of health units which were included in the export already. Health
units, for which no report has been entered, yet, are highlighted. E.g. in figure 4.1-23 you can see that "Kabarole!" found the reports from Butiiti, Kyarusozi, Katooke and Kyenjojo. The report 8/1994 from
Nyamabuga was not entered, yet. "Kabarole!" informs about the completion of the export with the message in figure 4.1-24:

Fig. 4.1-24: The message about the completion of the export.
Pressing the <Enter> key leaves the message and returns to the screen "Settings for Creating a DBaseIII
Compatible Export File" (compare figure 4.1-16). You can find the export file in the directory "OUTPUT". Figure 4.1-25 shows the structure of the export file:

Fig. 4.1-25: The structure of the export file according to the settings from figure 4.1-20.
The bold headings of each column are called fields of the created database file. Each row is a data set.
One data set contains data from one exported report. The first four fields are the same in every export file:
- "UNIT" contains the name of the health unit from which the report was exported.
- "ACTIVE" contains TRUE for a report from an active health unit and FALSE for a report from an inactive health unit.
- "REPNUMBER" contains the number of the reporting period.
- "REPYEAR" contains the year of the reporting period.
The following fields differ depending on the form, from which data were exported. Each entry field of a
form appears as a field of the exported database file. The name of the entry field is taken for the field name. In figure 4.1-25 these are the fields "NEWCASES" to "OTHERS3".
4.2. Basic Presentation Techniques Using "Kabarole!"
4.2.1.  - Creating a Monthly Summary Report for the District - Creating a Monthly Summary Report for the District
For this example, the following assumptions have been made:
- The district health team has to send a monthly summary report on activities of the outpatient departments to the ministry of health.
- Outpatient service is provided by all active health units in the district.
- All health units have to send a monthly report about the activities of their outpatient department to the district health team.
- The reports from the health units have been entered into the computer using "Kabarole!"
Starting from the "Present" menu (compare figure 4.1-1), you have to take the following steps to create the monthly summary report:
1. Choose "Calculate Summary Reports". "Kabarole!" will display the screen "Settings for Calculating a Summary Report" (compare figure 4.1-2).
2. Choose "Select a Form" from the "Options" box. "Kabarole!" will display the list of existing forms (compare figure 3.1-2).
3. Choose the report form for outpatient services from the list of existing forms. "Kabarole!" will insert the name of the chosen form into the "Settings" box.
4. Choose "Change First Report" from the "Options" box. The cursor will move to the entry field for the report number of the first report.
5. Enter the number and the year of the report in the "Settings" box.
6. Choose "Change Last Report" from the "Options" box. The cursor will move to the entry field for the report number of the last report.
7. Enter the same number and year as in step 5 in the "Settings" box.
8. Choose "Start Calculations and Print" from the "Options" box. "Kabarole!" will:
- display the screen "Calculate Summary Report" (compare figure 4.1-9),
- prepare the summary form,
- calculate the summary report from each health unit (compare figure 4.1-11),
- display the screen "Preview of the Summary Report" (compare figure 4.1-12).
9. Press <Esc> to continue. "Kabarole!" will ask you whether to print the summary report (compare figure 4.1-13).
10. Select "Print" from the message. "Kabarole!" will:
- print one copy of the summary report on the printer,
- return to the screen "Settings for Calculating a Summary Report" (compare figure 4.1-2).
11. Press <Esc> to leave the screen "Settings for Calculating a Summary Report". "Kabarole!" will return to the "Present Menu" (compare figure 4.1-1).
4.2.2.  - Creating a Monthly Summary Report for a Service - Creating a Monthly Summary Report for a Service
For this example, the following assumptions have been made:
- The district health team has to send a monthly summary report on a specific service to the ministry of health.
- The service is not provided by all active health units in the district.
- The providing health units are assigned to the service in "Kabarole!".
- The providing health units have to send a monthly report about the service to the district health team.
- The reports from the health units have been entered into the computer using "Kabarole!"
Starting from the "Present" menu (compare figure 4.1-1), you have to take the following steps to create the monthly summary report for a service:
1. Choose "Calculate Summary Reports". "Kabarole!" will display the screen "Settings for Calculating a Summary Report" (compare figure 4.1-2).
2. Choose "Select a Form" from the "Options" box. "Kabarole!" will display the list of existing forms (compare figure 3.1-2).
3. Choose the report form for the service from the list of existing forms. "Kabarole!" will insert the name of the chosen form into the "Settings" box.
4. Choose "Change First Report" from the "Options" box. The cursor will move to the entry field for the report number of the first report.
5. Enter the number and the year of the report in the "Settings" box.
6. Choose "Change Last Report" from the "Options" box. The cursor will move to the entry field for the report number of the last report.
7. Enter the same number and year as in step 5 in the "Settings" box.
8. Choose "Restrict Units on a Service" from the "Options" box. "Kabarole!" will display the list of services (compare figure 3.1-7).
9. Select the service from the list of services. "Kabarole!" will enter the name of the service in the "Settings" box.
10. Choose "Start Calculations and Print" from the "Options" box. "Kabarole!" will:
- display the screen "Calculate Summary Report" (compare figure 4.1-9),
- prepare the summary form,
- calculate the summary report from each health unit (compare figure 4.1-11),
- display the screen "Preview of the Summary Report" (compare figure 4.1-12).
11. Press <Esc> to continue. "Kabarole!" will ask you whether to print the summary report (compare figure 4.1-13).
12. Select "Print" from the message. "Kabarole!" will:
- print one copy of the summary report on the printer,
- return to the screen "Settings for Calculating a Summary Report" (compare figure 4.1-2).
13. Press <Esc> to leave the screen "Settings for Calculating a Summary Report". "Kabarole!" will return to the "Present Menu" (compare figure 4.1-1).
4.2.3.  - Creating a Yearly Summary Report for a Health Unit - Creating a Yearly Summary Report for a Health Unit
For this example, the following assumptions have been made:
- The district health team sends a yearly summary report on activities of the outpatient department of each health unit to the respective health unit.
- All health units have to send a monthly report about the activities of their outpatient department to the district health team.
- The reports from the health units have been entered into the computer using "Kabarole!"
Starting from the "Present" menu (compare figure 4.1-1), you have to take the following steps to create the yearly summary report for a health unit:
1. Choose "Calculate Summary Reports". "Kabarole!" will display the screen "Settings for Calculating a Summary Report" (compare figure 4.1-2).
2. Choose "Select a Form" from the "Options" box. "Kabarole!" will display the list of existing forms (compare figure 3.1-2).
3. Choose the report form for outpatient services from the list of existing forms. "Kabarole!" will insert the name of the chosen form into the "Settings" box.
4. Choose "Change First Report" from the "Options" box. The cursor will move to the entry field for the report number of the first report.
5. Enter the number "1" and the year of the summary report in the "Settings" box.
6. Choose "Change Last Report" from the "Options" box. The cursor will move to the entry field for the report number of the last report.
7. Enter the number "12" and the year of the summary report in the "Settings" box.
8. Choose "Select only Single Units" from the "Options" box. "Kabarole!" will display the district map for selecting single health units (compare figure 4.1-7).
9. Select the health unit for which to calculate the summary report from the district map. "Kabarole!" will:
- display the screen "Calculate Summary Report" (compare figure 4.1-9),
- prepare the summary form,
- calculate the summary report from each report of the selected health unit (compare figure 4.1-11),
- display the screen "Preview of the Summary Report" (compare figure 4.1-12).
10. Press <Esc> to continue. "Kabarole!" will ask you whether to print the summary report (compare figure 4.1-13).
11. Select "Print" from the message. "Kabarole!" will:
- print one copy of the summary report on the printer,
- return to the district map for selecting single health units (compare figure 4.1-7).
12. Restart from step 9 until the summary report for each health unit calculated.
13. Press <Esc> to leave the district map for selecting single health units. "Kabarole!" will return to
the screen "Settings for Calculating a Summary Report" (compare figure 4.1-2).
14. Press <Esc> to leave the screen "Settings for Calculating a Summary Report". "Kabarole!" will return to the "Present Menu" (compare figure 4.1-1).
4.2.4.  - Creating a "DBaseIII" Compatible Export File - Creating a "DBaseIII" Compatible Export File
For this example, the following assumptions have been made:
- For further evaluation with external programs, a selection of reports from a specific form has to be exported into a "DBaseIII" compatible export file.
- The involved health units have to send a regular report for the form to the district health team.
- The reports from the health units have been entered into the computer using "Kabarole!".
Starting from the "Present" menu (compare figure 4.1-1), you have to take the following steps to create a "DBaseIII" compatible export file for a specific report form:
1. Choose the option "Create Export Files" from the "Present" menu. "Kabarole!" will display the
screen "Settings for Creating a DBaseIII Compatible Export File" (compare figure 4.1-16).
2. Choose "Select a Form" from the "Options" box. "Kabarole!" will display the list of existing forms (compare figure 3.1-2).
3. Choose the data entry form from the list of existing forms. "Kabarole!" will insert the name of the chosen form into the "Settings" box.
4. Choose "Change First Report" from the "Options" box. The cursor will move to the entry field for the report number of the first report.
5. Enter the number and the year of the first report to be included in the "Settings" box.
6. Choose "Change Last Report" from the "Options" box. The cursor will move to the entry field for the report number of the last report.
7. Enter the number and the year of the last report to be included in the "Settings" box.
If you don't want to restrict data export on a group of health units skip steps 8 to 10.
8. Choose "Specify a Group" from the "Options" box. "Kabarole!" will display the "Categories" and "Groups" boxes (compare figure 3.1-5).
9. Select a category from the "Categories" box. The first group of the chosen category will be highlighted in the group box.
10. Select a group from the "Groups" box. "Kabarole!" will enter the name of the chosen group into the "Settings" box.
If you don't want to restrict data export to health units which offer a specific service, skip steps 11 to 12.
11. Choose "Restrict Units on a Service" from the "Options" box. "Kabarole!" will display the list of services (compare figure 3.1-7).
12. Select a service from the list of services. "Kabarole!" will enter the name of the chosen service in the "Settings" box.
Do step 13 only, if you want to include inactive health units.
13. Choose "Include Inactive Units" from the "Options" box. "Kabarole!" will toggle the setting
"Inactive Units are excluded." to "Inactive units are included.".
Do step 14 only, if you want to include outdated variables.
14. Choose "Include Outdated Variables" from the "Options" box. "Kabarole!" will toggle the
setting "Outdated Variables are excluded." to "Outdated Variables are included.".
If you want to export only data from a specific health unit:
15a. Choose "Select only Single Units" from the "Options" box. "Kabarole!" will display the district map for selecting single health units (compare figure 4.1-7).
15b. Select the health unit for which to calculate the summary report from the district map. "Kabarole!" will ask for the name of the export file (compare figure 4.1-21)
If you want to export data from a set of health units:
15. Choose "Create Export File" from the "Options" box. "Kabarole!" will ask for the name of the export file (compare figure 4.1-21)
16. Enter a name for the export file in the entry field for the file name. "Kabarole!" will:
- display the screen "Create Export File" (compare figure 4.1-22),
- prepare the export file,
- transfer the reports from the selected health unit (compare figure 4.1-23),
- display the message "Export completed!" (compare figure 4.1-24).
17. Press <Enter> to acknowledge the message. "Kabarole!" will return either to the district map for
selecting single health units (compare figure 4.1-7) or to the screen "Settings for Creating a DBaseIII Compatible Export File" (compare figure 4.1-16).
18. Press <Esc> to leave the district map. "Kabarole!" will return to the screen "Settings for Creating a DBaseIII Compatible Export File" (compare figure 4.1-16).
19. Press <Esc> to leave the screen "Settings for Creating a DBaseIII Compatible Export File".
"Kabarole!" will return to the "Present Menu" (compare figure 4.1-1).
4.3. Advanced Presentation Techniques using "EpiInfo"
4.3.1.  - Creating an Overview of Outpatient Visits as Bar Graph - Creating an Overview of Outpatient Visits as Bar Graph
For this example, the following assumptions have been made:
- The district health team wants an overview of how the outpatients are distributed to the health units.
- All health units have to send a monthly report about the activities of their outpatient department to the district health team.
- The reports from the health units have been entered into the computer using "Kabarole!"
- A "DBaseIII" compatible export file was created (compare section 4.2.4. "Creating a 'DBaseIII' Compatible Export File"). The export was done for the report form for outpatient data, including the
reports from all active health units for the demanded month.
- The "Analysis" module of "EpiInfo" (compare figure 4.3-1) is available.
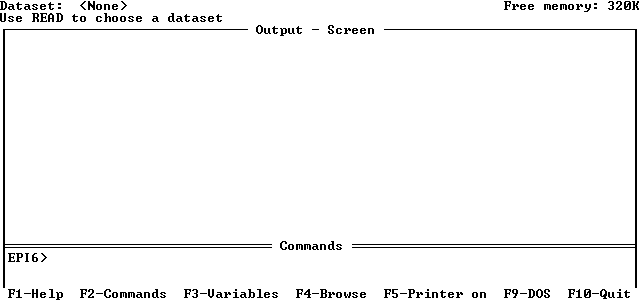
Fig. 4.3-1: The "Analysis" module of "EpiInfo".
Starting from the "Analysis" module, you have to take the following steps to create the bar graph:
1. Enter "read *.dbf" at the command prompt. "EpiInfo" will give you a selection box for file retrieval.
2. Select the export file from the "OUTPUT" directory. "EpiInfo" will load the export file.
Step 3 - 4 has to be done if the outpatient visits are distinguished between first- and reattendances:
3. Define a new numeric variable for the total attendances. E.g. for the new variable "TOTALATT"
enter "define totalatt". "EpiInfo" will display the message "Numeric variable created".
4. Add the total first attendances and the total reattendances into the variable "TOTALATT".
E.g. the report form contains the value for first attendances in the variable "FIRSTATTE4" and the value for reattendances in the variable "REATTENDA4". Then you have to enter "TOTALATT =
FIRSTATTE4 + REATTENDA4" at the command prompt. "EpiInfo" will add the two variables for each report.
5. Define a new string variable for the recoded value of "TOTALATT". E.g. to define the variable
"OUTPATIENTS" enter "define outpatients ____" at the command prompt. "EpiInfo" will display the message "String variable created".
6. Recode the numeric value from "TOTALATT" into classes by 200 into the new variable "OUTPATIENTS".
Enter "recode totalatt to outpatients by 200" at the command prompt. "EpiInfo" will
group the values from "TOTALATT" into groups with a difference of 200 patients. The classification is taken down in "OUTPATIENTS".
7. Define a title for the graph. E.g. enter 'Title 1 "\c Distribution of Outpatient Attendances"' for the first
line and 'Title 2 "\c September 1994"' for the second line at the command prompt.
8. Enter the command for the bar graph. E.g. enter 'bar outpatients \label="Number of Health Units"' at
the command prompt. "EpiInfo" will display the graph as shown in figure 4.3-2:
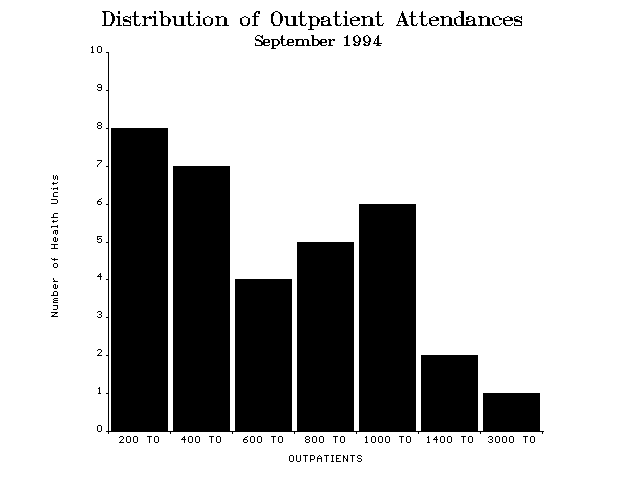
Fig. 4.3-2: A bar graph created with "EpiInfo"
4.3.2.  - Creating a Yearly Overview of Malaria Diagnoses for the District as Line Graph - Creating a Yearly Overview of Malaria Diagnoses for the District as Line Graph
For this example, the following assumptions have been made:
- The district health team wants an overview of how the number of Malaria diagnoses is distributed over the year.
- All health units have to send a monthly report about the activities of their outpatient department to the district health team.
- The reports from the health units have been entered into the computer using "Kabarole!"
- A "DBaseIII" compatible export file was created (compare section 4.2.4. "Creating a 'DBaseIII' Compatible Export File"). The export was done for the report form for outpatient data. The reports
from all active health units for the complete year were included.
- The "Analysis" module of "EpiInfo" (compare figure 4.3-1) is available.
Starting from the "Analysis" module, you have to take the following steps to create the line graph:
1. Enter "read *.dbf" at the command prompt. "EpiInfo" will give you a selection box for file retrieval.
2. Select the export file from the "OUTPUT" directory. "EpiInfo" will load the export file.
3. Define a title for the graph. E.g. enter 'Title 1 "\c Distribution of Malaria Diagnoses"' for the first line
and 'Title 2 "\c Kurungi District 1994"' for the second line at the command prompt.
4. Enter the command for the line graph. E.g. enter 'line repnumber /sum=malaria4 /label="Number of Malaria Diagnoses"' at the command prompt. "EpiInfo" will:
- summarize the variable "MALARIA4", which contains the total malaria diagnoses of one report, for each report number,
- display the graph as shown in figure 4.3-3.
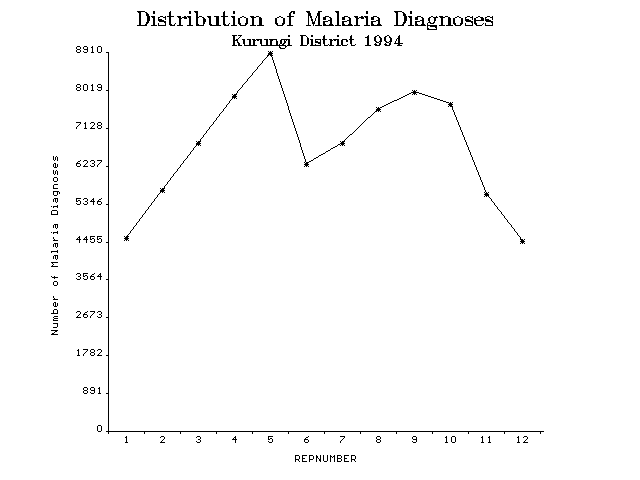
Fig. 4.3-3: A line graph created with "EpiInfo". The values are fictional.
|


